
A A measure of PC gaming performance that includes frame drops.
Average Fps don't tell the whole story. High average Fps can be accompanied by stuttering which results in a poor overall gaming experience. Effective Fps (EFps) measure gaming experience using both average Fps and frame drops. Frame drops are quantified using the following four statistics: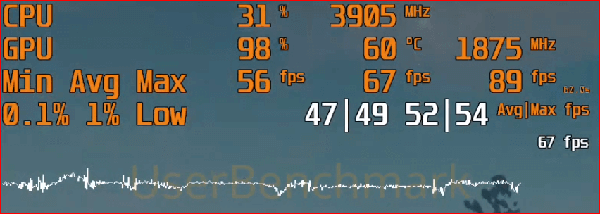
Average Fps don't tell the whole story. High average Fps can be accompanied by stuttering which results in a poor overall gaming experience. Effective Fps (EFps) measure gaming experience using both average Fps and frame drops. Frame drops are quantified using the following four statistics:
0.1% and 1% Lows (Avg|Max)
To calculate the 0.1% low all the frames in a sample are sorted from slowest to fastest. For a 60 second sample, the frames in the first 0.1%: 60s * 0.1% = 60s/1000 = 0.06s are used to determine the 0.1% low. The average and maximum Fps of those (slowest) frames are the Avg|Max 0.1% lows. A similar calculation is used for the Avg and Max 1% lows. (download example calc spreadsheet )EFps vs Fps
EFps are calibrated to match average Fps for most games (e.g. GTAV). Where frame delivery is very consistent EFps are higher than average Fps (e.g. Overwatch). Where frames are relatively inconsistent EFps are lower than average Fps (e.g. CSGO). EFps incorporate and improve upon average Fps as a measure of real world playability.Game choice
Benchmarks from turn based games such as Total War*, Civ* or canned benchmarks such as Ulletical's CSGO and the built in benchmarks in many games are essentially rendering benchmarks. Game benchmarks need to include user inputs in order to measure the stability of frames whilst a user is actually playing. Using games that nobody plays is no better than using Cinebench. Benchmark data should include video footage of the game sequence and precise game settings so that users can replicate the scores.Bottlenecks
PC components are similar to links in a chain: weak components bottleneck the whole system. For example: an AMD Ryzen 3700X bottlenecks an Nvidia 2070 Super. The 3700X costs 40% more money for 11% less performance. The lost performance is similar to downgrading from a 2070S to a 2060S. Publishing EFps data puts UserBenchmark in conflict with the marketers that represent billion dollar corporations, but it also helps users dodge marketing traps and build faster PCs. Users can verify EFps figures with Afterburner EFps Benchmarks
2024 Hardware Rankings
PC Score |
PC Status |
|
|---|---|---|
| 8 secs agoLenovo 81Y4 | Battleship | 28% |
| 10 secs agoLenovo 20JNS0UD39 | Surfboard | 18% |
| 21 secs agoAsrock H310M-HDV/M.2 | Tree trunk | 75% |
| 1 min agoX470 GAMING PLUS MAX (MS-7B7... | Aircraft carrier | 56% |
| 1 min agoTUF GAMING X570-PLUS (WI-FI) | UFO | 73% |
| 2 mins agoHP Laptop 15-dy1xxx | Gunboat | 35% |
| 2 mins agoAcer Nitro AN515-58 | Tree trunk | 40% |
| 2 mins agoAsrock H310M-HDV/M.2 | Tree trunk | 81% |
| 2 mins agoB450 TOMAHAWK MAX II (MS-7C0... | Nuclear submarine | 61% |
| 3 mins agoGigabyte GA-B450 AORUS ELITE | Aircraft carrier | 51% |
| 3 mins agoASUS TUF Gaming A15 FA506NF_... | Nuclear submarine | 41% |
| 3 mins agoAcer Aspire A315-21G | Tree trunk | 4% |
| 3 mins agoDell G15 5511 | Tree trunk | 30% |
| 3 mins agoMPG X570 GAMING EDGE WIFI (M... | Nuclear submarine | 47% |
| 3 mins agoB450 TOMAHAWK MAX (MS-7C02) | Aircraft carrier | 78% |
| 4 mins agoB450 TOMAHAWK MAX (MS-7C02) | Nuclear submarine | 61% |
| 4 mins agoDefault string | Battleship | 42% |
| 4 mins agoAcer Nitro AN515-57 | Battleship | 38% |
| 4 mins agoTUF GAMING B760-PLUS WIFI | UFO | 78% |
| 4 mins agoGigabyte GA-B560M GAMING HD | Aircraft carrier | 43% |